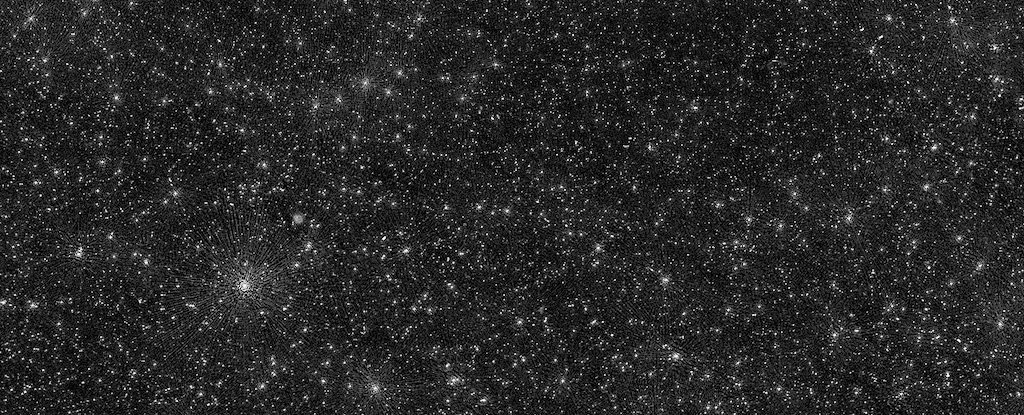
The image above may look like a fairly normal photo of the night sky, but what you’re looking at is much more special than just glittering stars. Each of those white dots is an active supermassive black hole.
And each of those black holes devours material at the heart of a galaxy millions of light years away – that is how they could be located at all.
With a total of 25,000 such dots, astronomers have created the most detailed map to date of black holes at low radio frequencies, a feat that took years and assembled a radio telescope the size of Europe.
“This is the result of years of work on incredibly difficult data,” explains astronomer Francesco de Gasperin of the University of Hamburg in Germany. “We had to come up with new methods to convert the radio signals into images of the sky.”
 (LOFAR / LOL survey)
If they just hang out and don’t do much, black holes don’t give off detectable radiation, making them much harder to find. When a black hole is actively collecting material – winding up a disk of dust and gas circling around it like water encircles a drain – the intense forces generate multi-wavelength radiation that we can detect in vast space.
What makes the above image so special is that it covers the ultra-low radio wavelengths, as detected by the LOw Frequency ARray (LOFAR) in Europe. This interferometric network consists of approximately 20,000 radio antennas, spread over 52 locations in Europe.
Currently, LOFAR is the only radio telescope network capable of deep, high-resolution imaging at frequencies below 100 megahertz, providing unparalleled views of the sky. This data release, covering four percent of the northern sky, is the first of the network’s ambitious plan to map the entire northern sky in ultra-low frequencies, the LOFAR LBA Sky Survey (LoLSS).
Being Earth-based, LOFAR has one major hurdle to overcome that doesn’t affect space telescopes: the ionosphere. This is particularly problematic for ultra-low frequency radio waves, which can be reflected back into space. At frequencies below 5 megahertz, the ionosphere is opaque for this reason.
The frequencies entering the ionosphere can vary depending on atmospheric conditions. To solve this problem, the team used supercomputers with algorithms to correct for ionospheric interference every four seconds. During the 256 hours that LOFAR was staring at the sky, that’s a lot of corrections.
This has given us such a clear view of the ultra-low-frequency sky.
“After many years of software development, it is so good to see that this has really succeeded”, says astronomer Huub Röttgering of the Leiden Observatory in the Netherlands.
Having to correct for the ionosphere has another advantage: It allows astronomers to use LoLSS data to study the ionosphere itself. Ionic traveling waves, scintillations and the relationship of the ionosphere with solar cycles could be characterized in much more detail with the LoLSS. This will allow scientists to better constrain ionospheric models.
And the research will provide new data on a variety of astronomical objects and phenomena, as well as potentially undiscovered or unexplored objects in the area below 50 megahertz.
“The final publication of the survey will facilitate progress in a range of astronomical research areas,” the researchers wrote in their paper.
[This] will enable the study of more than 1 million low-frequency radio spectra, providing unique insights into physical models for galaxies, active nuclei, galaxy clusters and other areas of research. This experiment represents a unique attempt to explore the ultra-low frequency sky with high angular resolution and depth. “
The results are published in Astronomy and Astrophysics